
1.Introduction
SenzConnect Monitor Dashboard is a powerful real-time monitoring application designed to give you complete control over your sensor data. It enables users to seamlessly track live data streams, visualize readings through dynamic graphs, and perform in-depth analysis with ease.
With an intuitive interface, the platform allows customers to integrate and manage multiple SenzConnect modules within a single unified dashboard.
Users can effortlessly export collected data into CSV files for reporting, further analysis, or record-keeping. The combination of real-time visualization, flexible device management, and data export capabilities makes SenzConnect an essential tool for data-driven decision-making.
Features
-
Real-Time Monitoring
-
Interactive Graphs
-
Multi-Device Support
-
Data Analysis
-
CSV Export
-
User-Friendly UI
Note:
SenzConnect Dashboard is currently supported only on Windows operating systems.
3.Prerequisites
Before using SenzConnect Monitor, ensure you have:
- SenzConnect device
- 5V USB-C power supply
- Wi-Fi-enabled PC (Windows)
- Access to a Wi-Fi network
- MQTT broker credentials and SSL certificates (Optional)
4.How to use SenzConnect Monitor
The following sections provide guidance on how to use SenzConnect Monitor with SenzConnect modules.
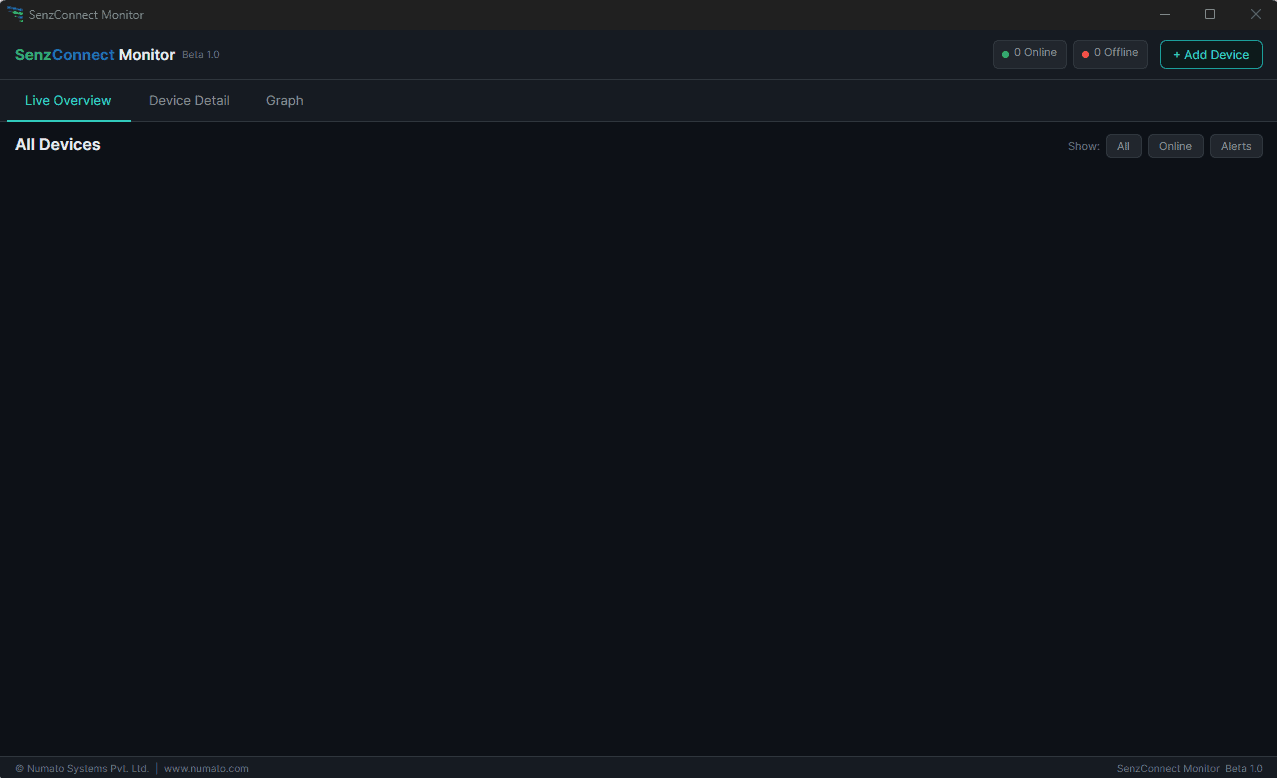
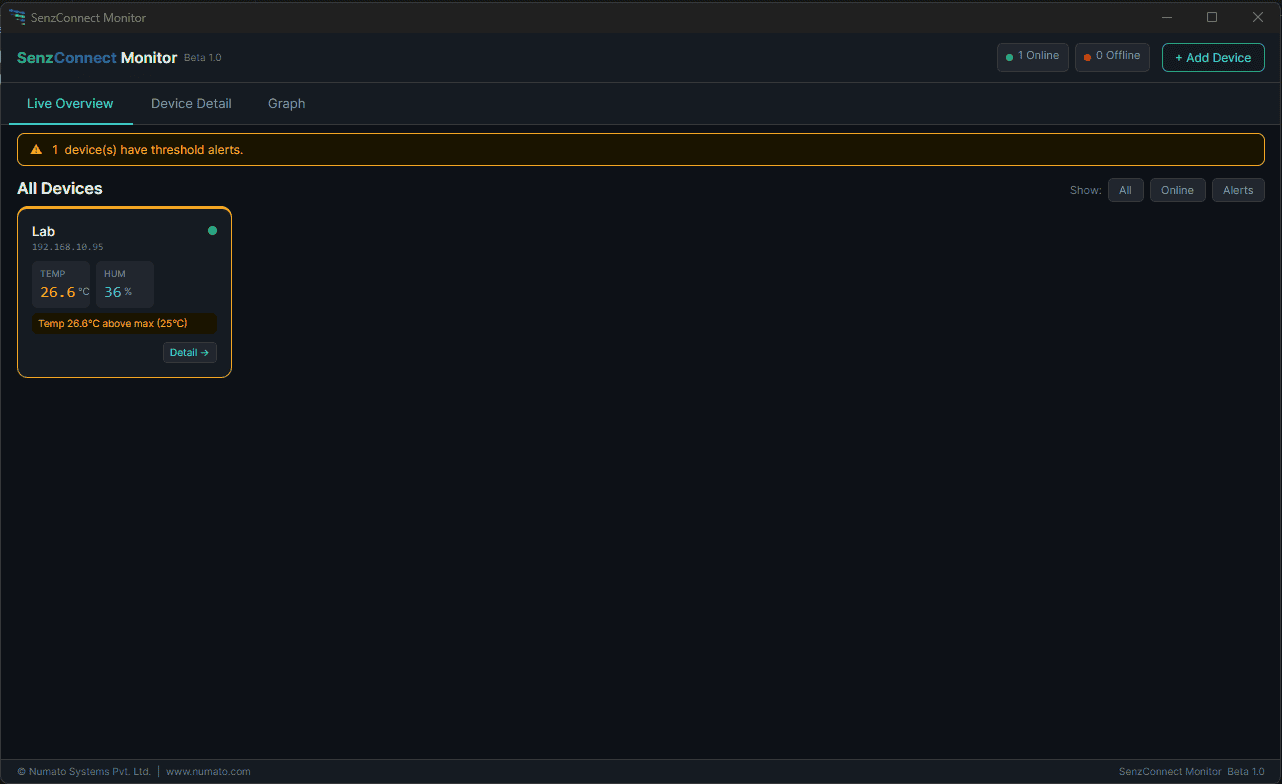
4.1.Live Overview
The Live Overview page provides a real-time overview of system data.
Features
- Live sensor values
- Device status indicators
- Alert notifications (real-time)
Users can:
- Monitor environmental parameters
- Identify anomalies
4.1.1.Adding a Device
The Add Device feature in SenzConnect Monitor allows users to connect and start monitoring new SenzConnect-enabled devices within the dashboard.
Before adding a device, ensure:
- The SenzConnect device is powered ON
- The device is connected to the same network as the Monitor
- The device IP address is accessible
Steps to Add a Device
- Click on “Add Device”
- Enter the required details:
- Device Name (user-defined identifier)
- IP Address of the device
- Username
- Password
- Click Test Connection to verify device availability
- Select Save and Add
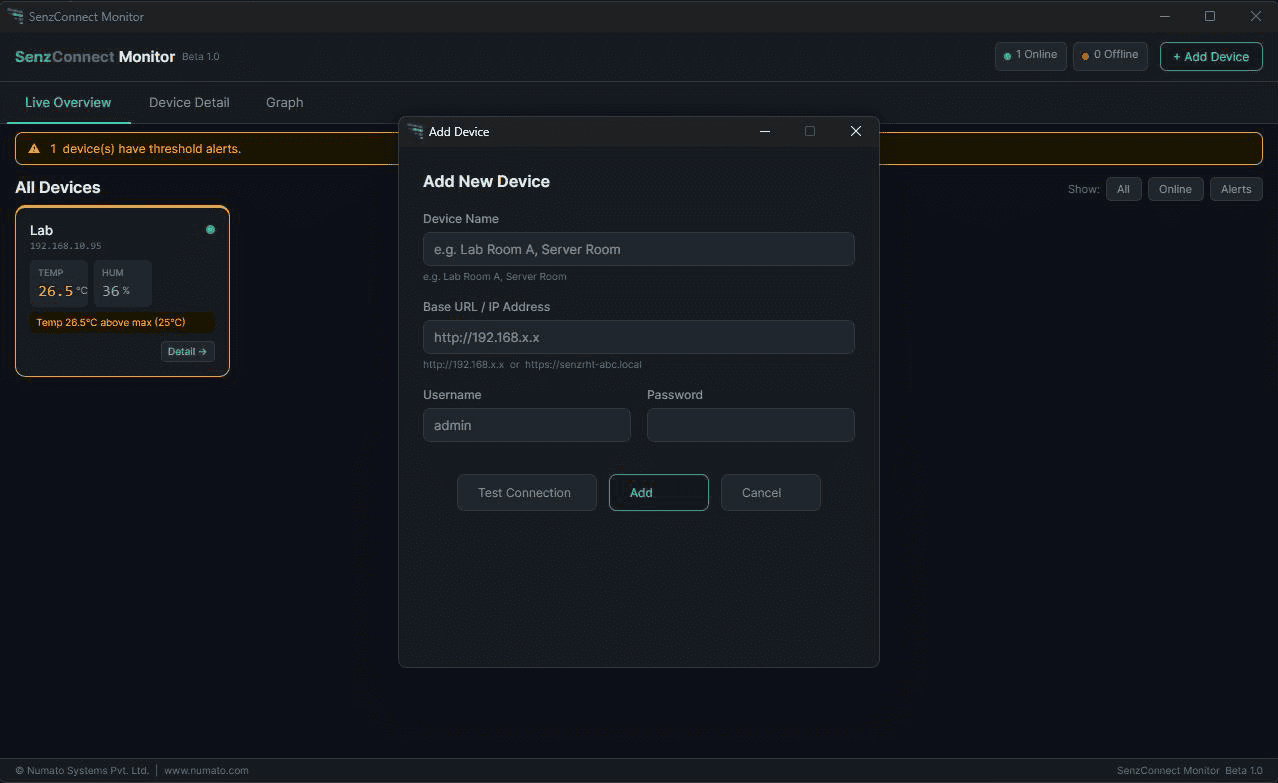
The device is now successfully added to your dashboard.
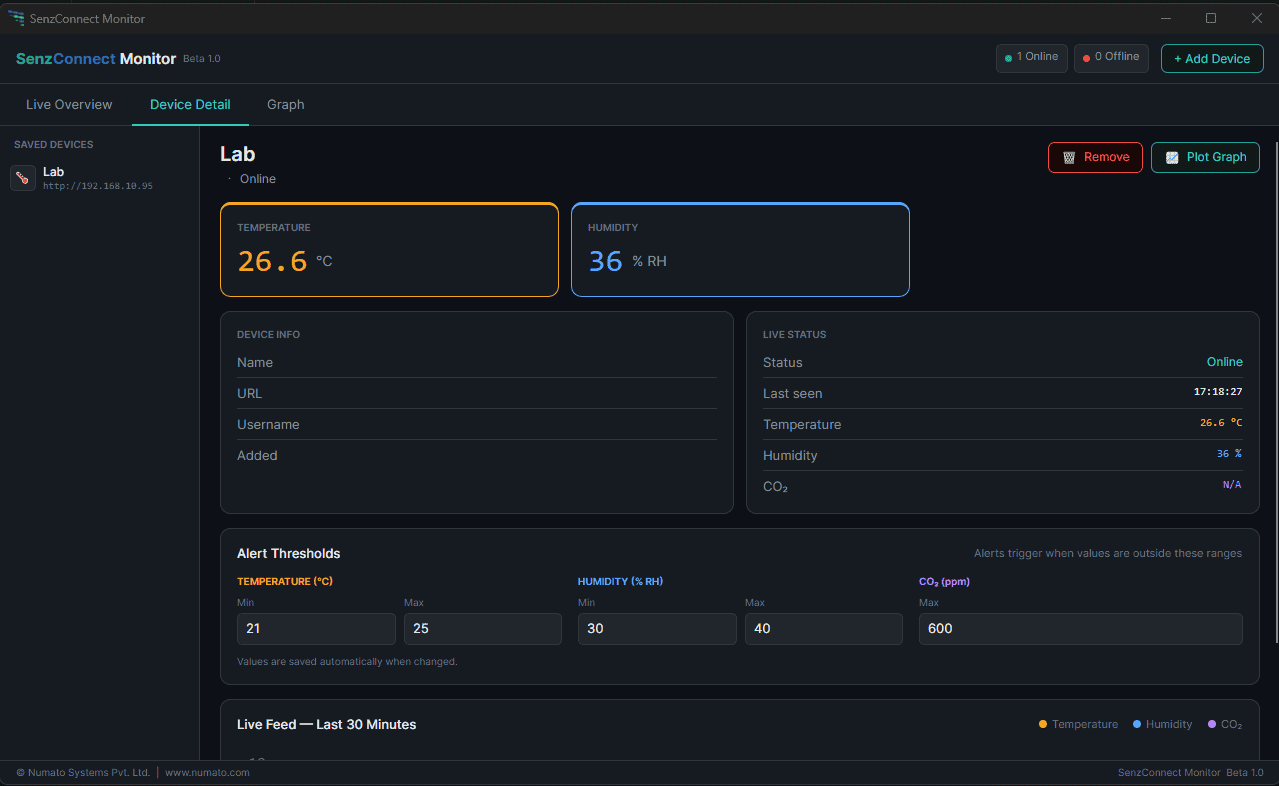
4.2.Device Detail
Click on “Detail” in the device or “Device Detail” to:
- View detailed data
- Access device-specific metrics
- Monitor performance
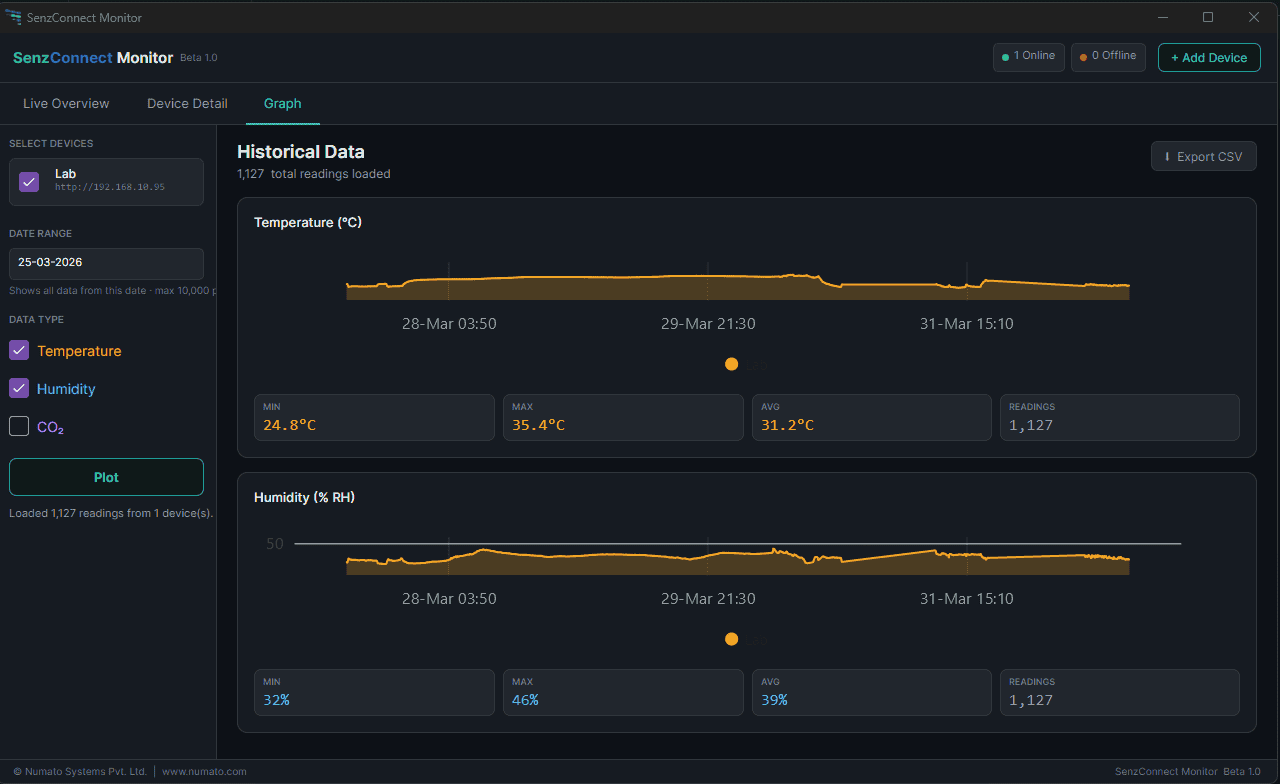
4.3.Graph
SenzConnect Monitor allows users to visually analyse device data using time-based charts.
Supported Views
- Line charts (time-series data)
- Historical trends
Steps to Generate a Graph
- Navigate to the “Graph” page from the dashboard
- Select the device(s) you want to analyse
- Choose the desired date range
- Select the data type / parameter (e.g., temperature, humidity)
- Click on “Plot”
4.3.1.Export Graph
SenzConnect Monitor allows users to export visualized data for offline analysis and reporting.
- Click on the “Export CSV” option
- Save the graph in the CSV format
5.Video Demonstration
6.Conclusion
You are now ready to start monitoring and managing your SenzConnect devices using the Windows application. With centralised control, real-time insights, and easy data access, the platform is designed to simplify your workflow and improve visibility across all connected devices.